User research is exciting: observing people using your product, understanding their mindsets better in interviews, receiving feedback on usability issues.
But what do you do with all the data that you collect? You usually come out with a ton of notes – how do you make sense of it?
Focus on the right level of detail while capturing notes
Data analysis starts with how you capture your notes. It requires some practice to find the right balance. You don’t need to capture everything word-for-word. Instead you want to focus on the key message that gives you the answer to your question.
Example: You want to find out if a person uses public transit for the daily commute and what the reasons are.
Question: How do you usually commute to your workplace?
Answer: It depends. In the summer time I mostly use my bike to get some extra exercise in. There is a great bike path from my place that makes it super convenient. I hate biking in the rain, so in the winter time I usually take my car. I sometimes coordinate with a co-worker of mine and we share a ride – depending on our schedule and wether I need a car during the day or not. I don’t use public transit – it’s too complicated from my place, I have to change 3 times and the busses are often packed in rush hour.
If your interest is on the behaviour around public transit, your notes might look like this:
Doesn’t take transit – too many stops, busses too full. Prefers bike or car.
Your goal is to condense messages as much as possible without loosing the key information.
Capture quotes of key messages
It’s always helpful to have real quotes that you can sprinkle throughout your final presentation. It makes it more relatable and can help to emphasize your finding. Switch to verbatim transcript whenever you hear a strong opinion.
In the example above you want to add this quote to your notes:
“I don’t use transit – it’s too complicated from my place, I have to change 3 times and the busses are often packed in rush hour.”
Capturing notes in a spreadsheet for structured interviews
I use different note taking tools, depending on the purpose of my research. If I am in discovery mode and have a very open study (which means I only start with a small set of questions and let the interview be guided by whatever I discover), I prefer to use a word format.
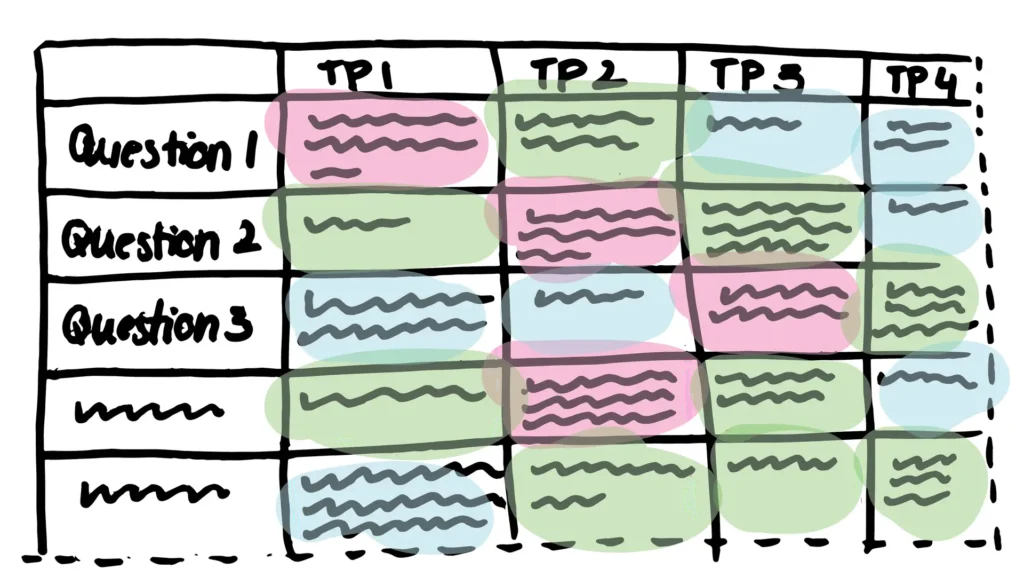
For usability tests or more structured interviews – means I have a specific research goal in mind and an interview guide – I often use a spreadsheet format. Here I list all of my questions in one column and keep answers for each interview across.

I find this the most efficient way of analyzing the data: I can easily compare answers across a single question.
Find patterns with color coding
Once you are done you sit in a big mess. Lots of notes that you now need to summarize somehow.
Your main goal is to find patterns: what are commonalities in the answers? What are the main differences/ contrasts?
I like to start with color coding my spreadsheet. For example positive feedback in green, negative reactions in red, questions and uncertainties in blue, nice-to-knows in yellow. This helps me visually to see patterns faster.

Find key topics by grouping
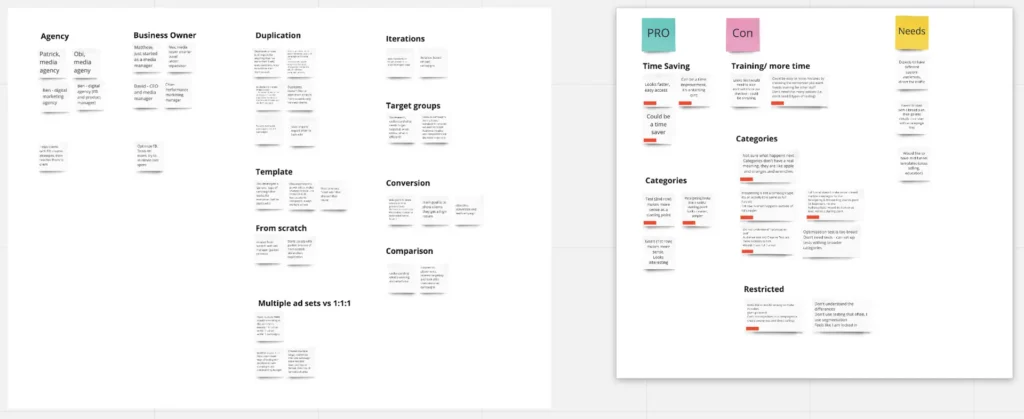
If my research is less structured or the amount of data is too overwhelming, I often use the “stickies approach”. I put the key insights on post-its (in a physical or digital form) and group them to find the key topics.
I love using realtimeboard for this exercise: it allows me to easily import notes from a spreadsheet, to cluster them, tag them and drag them around for a good pattern finding approach.

Experiment to find your own way
I hope these insights are giving you some inspiration. Go and experiment with different tools and different formats to find a way that works best for you. You can share any insights or questions in the comments.
